728x90
반응형
# dasos['Date'] = pd.to_datetime(dasos['Date'], format='%Y-%m-%d %H:%M:%S')
# dasos.head()
728x90
반응형
# dasos['Date'] = pd.to_datetime(dasos['Date'], format='%Y-%m-%d %H:%M:%S')
# dasos.head()
# ind_sub = df['NO2'].loc[(df['Date'] >= '2019-11-13 16:00:00') & (df['Date'] <= '2020-02-14 13:00:00')].index.tolist()
# # ind_sub
에러:
24:00 로 시간이 표시되면 에러 발생
23:00 로 바꾸고, 날짜 바꾸고 월, 년 다 바꿔야 함.
아래 와 같이 해결
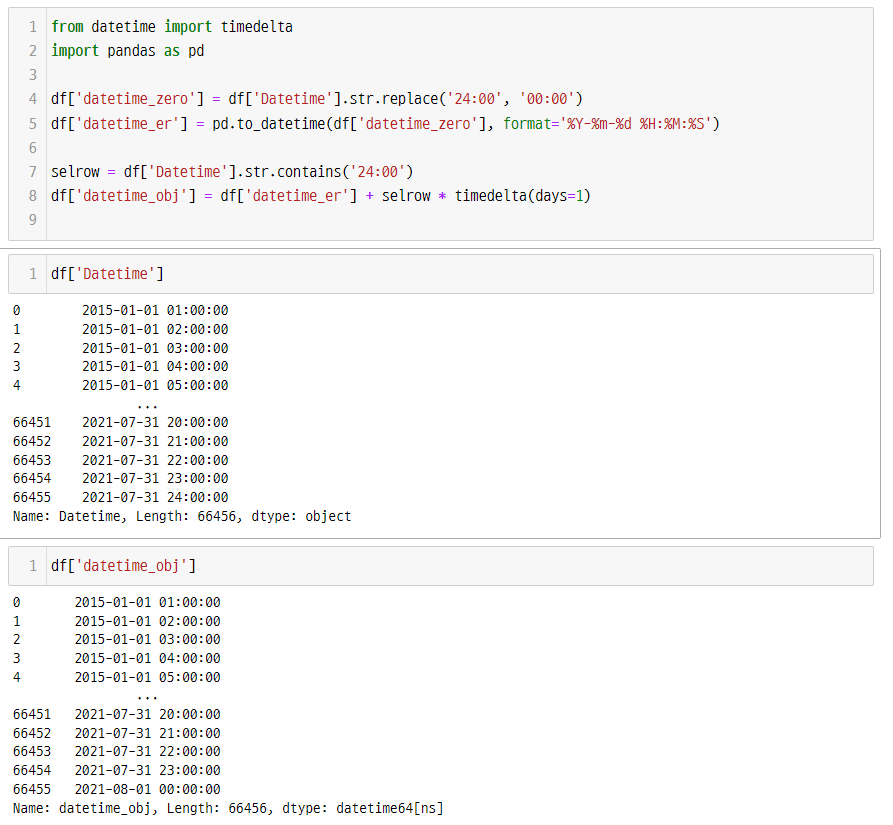
코드:
from datetime import timedelta
import pandas as pd
df['datetime_zero'] = df['Datetime'].str.replace('24:00', '00:00')
df['datetime_er'] = pd.to_datetime(df['datetime_zero'], format='%Y-%m-%d %H:%M:%S')
selrow = df['Datetime'].str.contains('24:00')
df['datetime_obj'] = df['datetime_er'] + selrow * timedelta(days=1)
ValueError: time data '10/11/2006 24:00' does not match format '%d/%m/%Y %H:%M'
I tried: df["datetime_obj"] = df["datetime"].apply(lambda dt: datetime.strptime(dt, "%d/%m/%Y %H:%M")) but got this error: ValueError: time data '10/11/2006 24:00' does not match format '%d/...
stackoverflow.com
https://kkwor1d.tistory.com/39?category=986286
[에러해결] datetime | hour 24:00:00 변환 오류
Problem with converting to 'datetime' type: ValueError: hour must be in 0..23. [문제] 시계열 자료에서 시간 데이터는 datetime 처리 후 작업을 하는데, 간혹 데이터 중에 시간 부분이 '24시'로 표현되어 있..
kkwor1d.tistory.com
이 둘은 2차원 데이터만 가능하므로 reshape(-1, 1)로 차원 변경해야 한다.
train_array = np.arrange(0, 11).reshape(-1,1)
test_array = np.arrange(0, 6).reshape(-1,1)
fit( ) 의 경우 [0,10] 스케일이 적용됨.
일반적으로 fit_transform( )을 사용하여 학습데이터와 테스트 데이터 스케일을 변환한다. 이는 fit( )과 transform( )을 순차적으로 수행하는 메소드이다.
따라서, 정확히 사용하려면, 학습과 테스트 데이터를 분리하기 전에 스케일링을 적용하고 분리해야 한다.
이 주의사항은 차원축소변환, 피쳐벡터화 변화 작업에도 동일하게 적용된다.
df = dd.reset_index()['Tair']
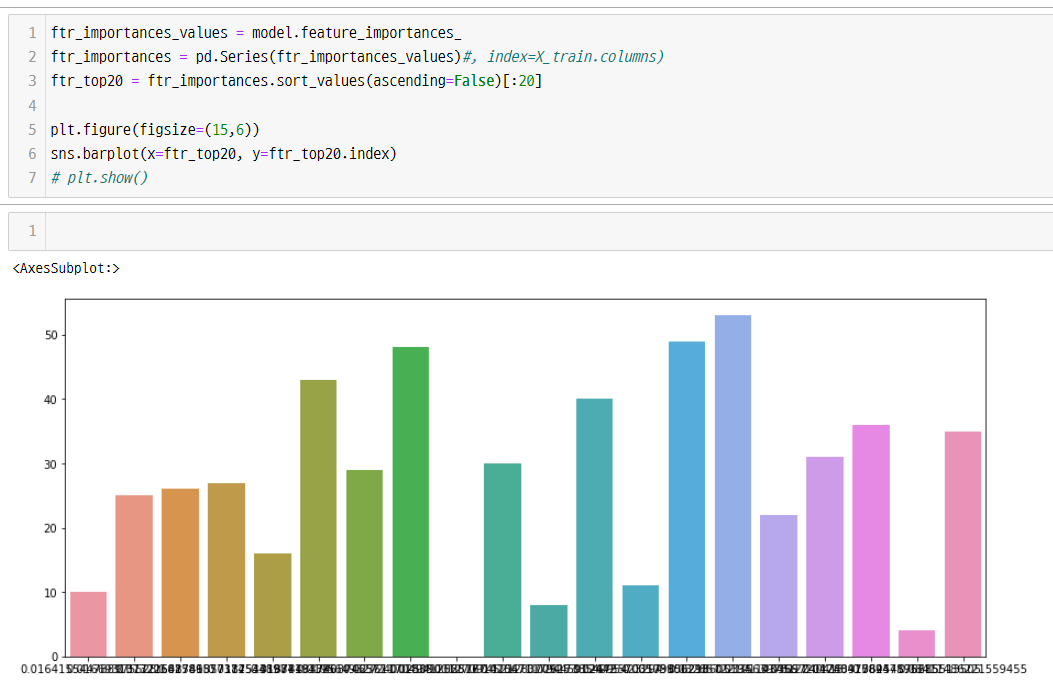
코드
ftr_importances_values = model.feature_importances_
ftr_importances = pd.Series(ftr_importances_values)#, index=X_train.columns)
ftr_top20 = ftr_importances.sort_values(ascending=False)[:20]
plt.figure(figsize=(15,6))
sns.barplot(x=ftr_top20, y=ftr_top20.index)
# plt.show()

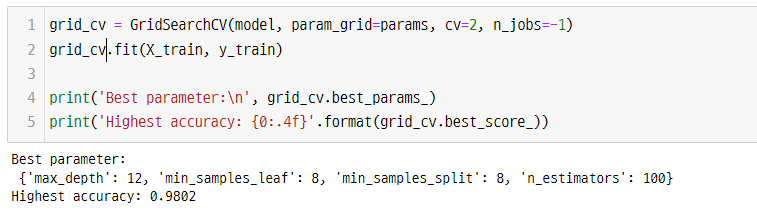
코드
from sklearn.model_selection import GridSearchCV
params = {
'n_estimators':[100],
'max_depth' : [6,8,10.,12],
'min_samples_leaf' : [8,12, 18],
'min_samples_split' : [8,16, 20]
}
rf_clf = RandomForestClassifier(random_state=0)
model = rf_clf
grid_cv = GridSearchCV(model, param_grid=params, cv=2, n_jobs=-1)
grid_cv.fit(X_train, y_train)
print('Best parameter:\n', grid_cv.best_params_)
print('Highest accuracy: {0:.4f}'.format(grid_cv.best_score_))
출처: 파이썬 머신러닝 완벽가이드 p220
def roc_curve_plot(y_test, pred_proba_c1):
fprs, tprs, thresholds = roc_curve(y_test, pred_proba_c1)
plt.plot(fprs, tprs, label='ROC')
plt.plot([0,1], [0,1], 'k--', label='Random')
start, end = plt.xlim()
plt.xticks(np.round(np.arange(start, end, 0.1), 2))
plt.xlim(0,1);plt.ylim(0,1)
plt.xlabel('FPR( 1 - sensitivity )'); plt.ylabel('TPR( Recall )')
plt.legend()
from sklearn.metrics import accuracy_score, precision_score, recall_score, confusion_matrix, f1_score, roc_auc_score
from sklearn.metrics import roc_curve
def get_clf_eval(y_test, pred=None, pred_proba=None):
    confusion = confusion_matrix(y_test, pred)
    accuracy= accuracy_socre(y_test, pred)
    precision = precision_score(y_test, pred)
    recall = recall_score(y_test, pred)
    f1 = f1_score(y_test, pred)
    roc_auc = roc_auc_score(y_test, pred_proba)
    print('error matrix')
    print(confusion)
    print('Accu : {0:.4f}, Prec : {1:.4f}, Recu : {2:.4f},\
F1 : {3:.4f}, AUC : {4:.4f}'.format(accuracy, precision, recall, f1, roc_auc))전처리 과정에서, 시계열 데이터를 살펴볼때 아래와 같이 slider 를 사용하면 missing-data 를 찾거나, 경향성 파악에 크게 도움이 된다.
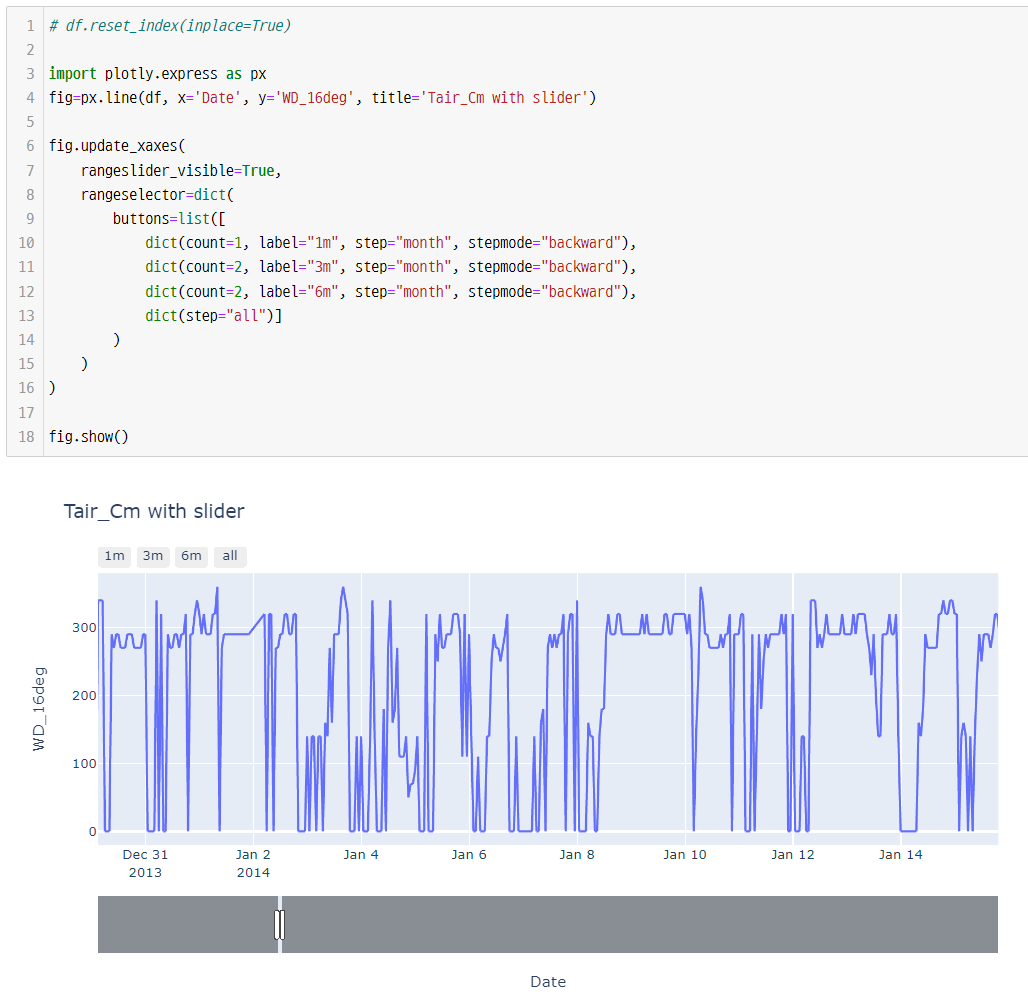
코드
df.reset_index(inplace=True)
import plotly.express as px
fig=px.line(df, x='Date', y='Tair_C', title='Tair_Cm with slider')
fig.update_xaxes(
rangeslider_visible=True,
rangeselector=dict(
buttons=list([
dict(count=1, label="1m", step="month", stepmode="backward"),
dict(count=2, label="3m", step="month", stepmode="backward"),
dict(count=2, label="6m", step="month", stepmode="backward"),
dict(step="all")]
)
)
)
fig.show()
datetime 변환 코드 상에서 이와 같은 에러가 발생
pandas 데이터 인식이 잘 못된 경우일 수 있다. 아래와 같이 설정
train["datetime"] = pd.to_datetime(train["datetime"])
.dt에서 어트리뷰트 에러발생 - 인프런 | 질문 & 답변 (inflearn.com)
.dt에서 어트리뷰트 에러발생 - 인프런 | 질문 & 답변
train['year'] = train['datetime'].dt.year train['month'] = train['datetime'].dt.month train['day'] = train['datetime'].dt.day train['hour'] = train['...
www.inflearn.com