머신러닝
- Anaconda :: 윈도우 아나콘다 제거방법 2023.02.01
- 영재원 :: 중등지구과학 사사과정 (2022) 머신러닝 기상예측 코드 (비공개) 2022.09.29
- 영재원 :: 중등지구과학 사사과정 (2022) 머신러닝 결과 x-hr 자료 사용에 따른 결과 차이 (Phen 포함) 2022.09.29
- scaler 스케일 변환시 주의사항 2022.01.21
- 가중치 Weights를 출력하는 방법 2022.01.20
- ValueError: Input 0 of layer "sequential" is incompatible with the layer: expected shape=(None, 100, 1), found shape=(None, 21) 2022.01.20
- Importance 바차트 출력 2022.01.17
- GridSearchCV 평가 - 최적 파라미터 출력 2022.01.17
- def roc_curve_plot() 함수 코드 2022.01.17
- def get_clf_eval() 함수 코드 2022.01.17
Anaconda :: 윈도우 아나콘다 제거방법
2023. 2. 1. 12:57
영재원 :: 중등지구과학 사사과정 (2022) 머신러닝 기상예측 코드 (비공개)
2022. 9. 29. 17:31
영재원 :: 중등지구과학 사사과정 (2022) 머신러닝 결과 x-hr 자료 사용에 따른 결과 차이 (Phen 포함)
2022. 9. 29. 17:28
728x90
반응형
At-A-Glance
- 나이브 베이즈 vs. 의사결정나무
- Phen 자료 포함
- 1,2 시간 전 자료 모두 사용한 경우
- 1 시간 전 자료만 사용한 경우
나이브 베이즈
1,2 시간 전 자료 모두 사용
               precision    recall  f1-score   support

           0       0.99      0.84      0.91     10479
           1       0.59      0.99      0.74       193
           2       0.58      0.90      0.70      2480

    accuracy                           0.86     13152
   macro avg       0.72      0.91      0.78     13152
weighted avg       0.90      0.86      0.87     13152
1시간 전자료만 사용
               precision    recall  f1-score   support

           0       0.98      0.86      0.92     10479
           1       0.59      1.00      0.74       193
           2       0.60      0.87      0.71      2480

    accuracy                           0.86     13152
   macro avg       0.72      0.91      0.79     13152
weighted avg       0.90      0.86      0.87     13152
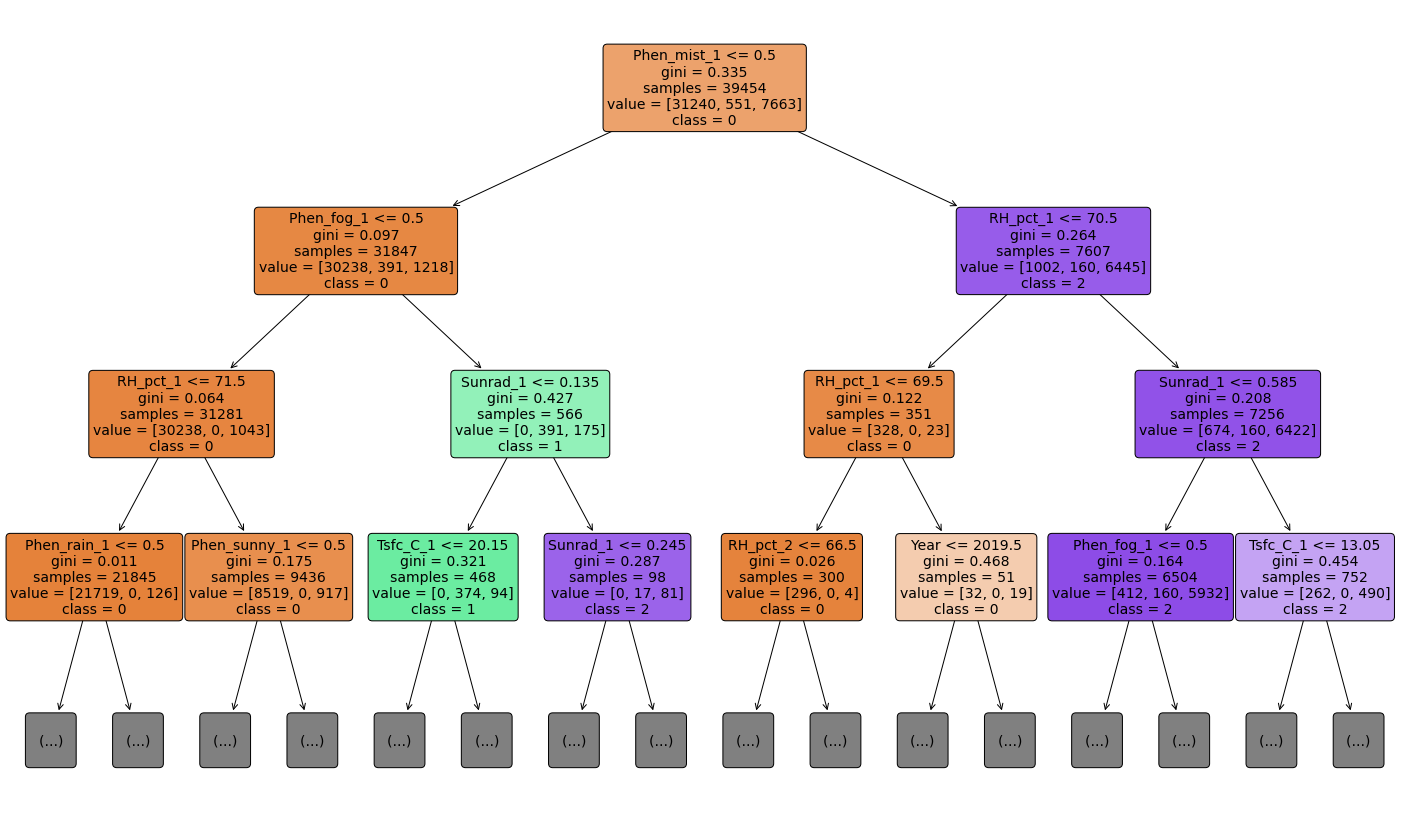
의사결정나무
1,2 시간 전 자료 모두 사용
               precision    recall  f1-score   support

           0       0.96      0.95      0.96     10479
           1       0.77      0.70      0.73       193
           2       0.79      0.82      0.81      2480

    accuracy                           0.93     13152
   macro avg       0.84      0.82      0.83     13152
weighted avg       0.93      0.93      0.93     13152
1시간 전 자료만 사용
               precision    recall  f1-score   support

           0       0.96      0.95      0.95     10479
           1       0.79      0.78      0.78       193
           2       0.77      0.80      0.79      2480

    accuracy                           0.92     13152
   macro avg       0.84      0.84      0.84     13152
weighted avg       0.92      0.92      0.92     13152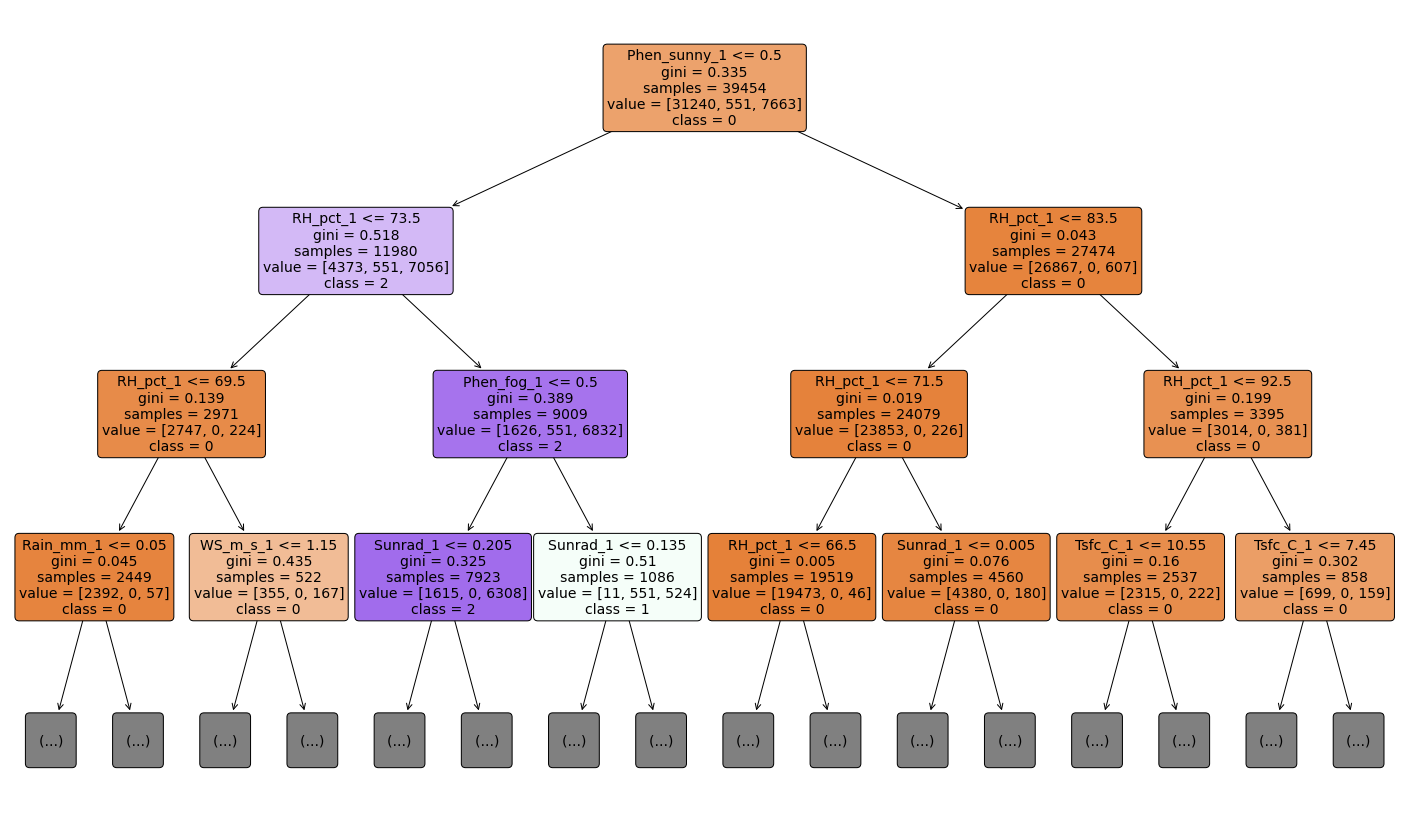
728x90
반응형
scaler 스케일 변환시 주의사항
2022. 1. 21. 12:41
728x90
반응형
학습/테스트 데이터의 스케일 변환시 주의사항
MinMaxScaler 객체의 fit( ) 과 transform( )
이 둘은 2차원 데이터만 가능하므로 reshape(-1, 1)로 차원 변경해야 한다.
train_array = np.arrange(0, 11).reshape(-1,1)
test_array = np.arrange(0, 6).reshape(-1,1)
fit( ) 의 경우 [0,10] 스케일이 적용됨.
일반적으로 fit_transform( )을 사용하여 학습데이터와 테스트 데이터 스케일을 변환한다. 이는 fit( )과 transform( )을 순차적으로 수행하는 메소드이다.
학습데이터에서는 상관없지만, 테스트 데이터에서는 fit_transform( )을 절대 사용해서는 안된다.
따라서, 정확히 사용하려면, 학습과 테스트 데이터를 분리하기 전에 스케일링을 적용하고 분리해야 한다.
이 주의사항은 차원축소변환, 피쳐벡터화 변화 작업에도 동일하게 적용된다.
728x90
반응형
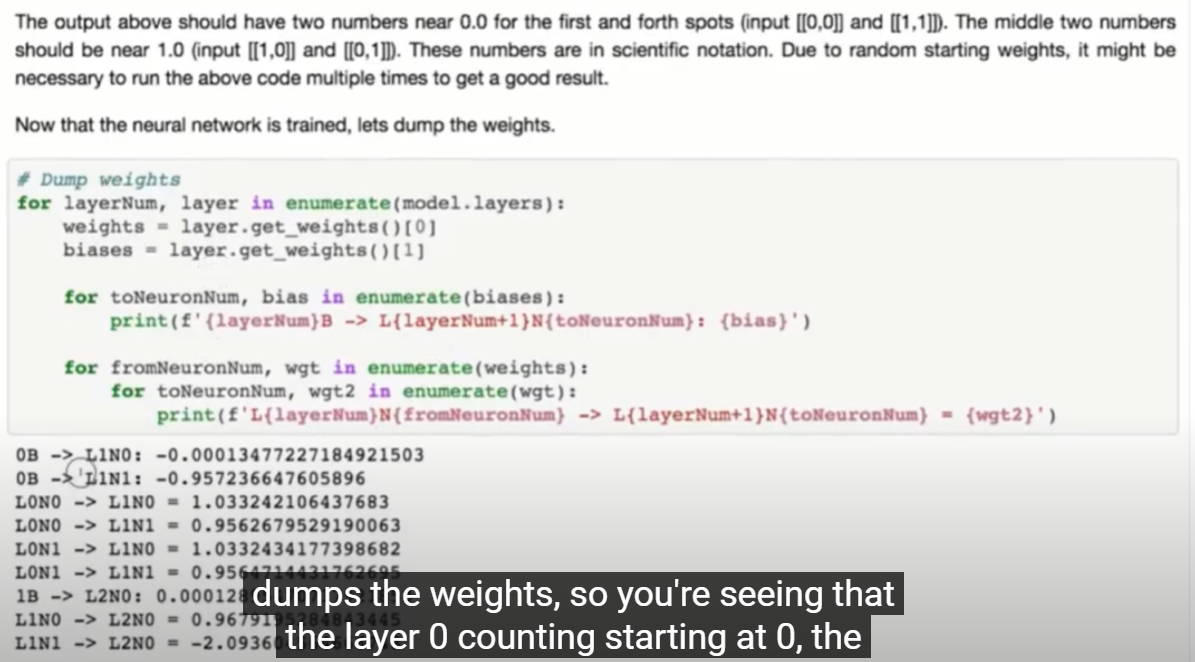
가중치 Weights를 출력하는 방법
2022. 1. 20. 14:59

ValueError: Input 0 of layer "sequential" is incompatible with the layer: expected shape=(None, 100, 1), found shape=(None, 21)
2022. 1. 20. 11:54
728x90
반응형
LSTM 다룰 때 중요한 부분!
에러
ValueError: Input 0 of layer "sequential" is incompatible with the layer: expected shape=(None, 100, 1), found shape=(None, 21)
원인
LSTM 모델을 사용할 때는, train 차원을 바꾸어야 하는데, 차원 변경을 해 주지 않으면 발생하는 에러
해결
X_train = X_train.reshape(X_train.shape[0], X_train[1], 1)
명령으로 2차원 데이터를 3차원으로 변경하면 됨.
728x90
반응형
Importance 바차트 출력
2022. 1. 17. 17:59
728x90
반응형
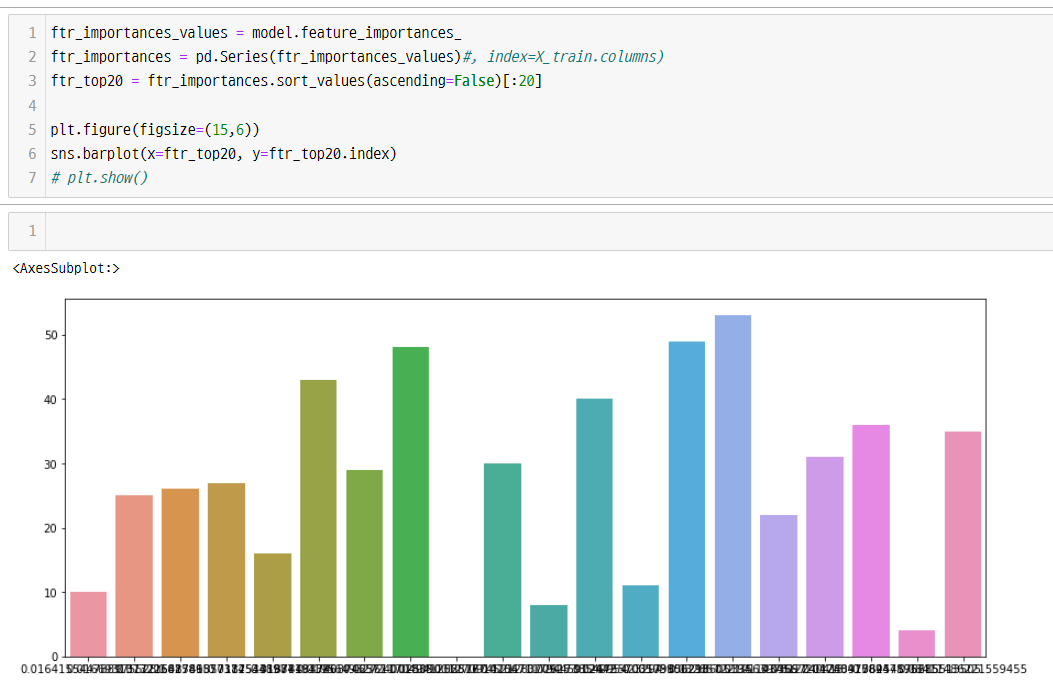
코드
ftr_importances_values = model.feature_importances_
ftr_importances = pd.Series(ftr_importances_values)#, index=X_train.columns)
ftr_top20 = ftr_importances.sort_values(ascending=False)[:20]
plt.figure(figsize=(15,6))
sns.barplot(x=ftr_top20, y=ftr_top20.index)
# plt.show()
728x90
반응형
GridSearchCV 평가 - 최적 파라미터 출력
2022. 1. 17. 17:49
728x90
반응형

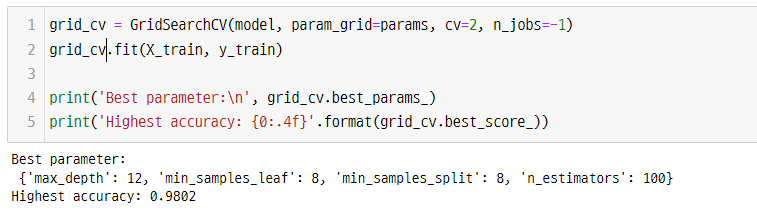
코드
from sklearn.model_selection import GridSearchCV
params = {
'n_estimators':[100],
'max_depth' : [6,8,10.,12],
'min_samples_leaf' : [8,12, 18],
'min_samples_split' : [8,16, 20]
}
rf_clf = RandomForestClassifier(random_state=0)
model = rf_clf
grid_cv = GridSearchCV(model, param_grid=params, cv=2, n_jobs=-1)
grid_cv.fit(X_train, y_train)
print('Best parameter:\n', grid_cv.best_params_)
print('Highest accuracy: {0:.4f}'.format(grid_cv.best_score_))
출처: 파이썬 머신러닝 완벽가이드 p220
728x90
반응형
def roc_curve_plot() 함수 코드
2022. 1. 17. 17:19
728x90
반응형
def roc_curve_plot(y_test, pred_proba_c1):
fprs, tprs, thresholds = roc_curve(y_test, pred_proba_c1)
plt.plot(fprs, tprs, label='ROC')
plt.plot([0,1], [0,1], 'k--', label='Random')
start, end = plt.xlim()
plt.xticks(np.round(np.arange(start, end, 0.1), 2))
plt.xlim(0,1);plt.ylim(0,1)
plt.xlabel('FPR( 1 - sensitivity )'); plt.ylabel('TPR( Recall )')
plt.legend()
728x90
반응형
def get_clf_eval() 함수 코드
2022. 1. 17. 16:21
728x90
반응형
from sklearn.metrics import accuracy_score, precision_score, recall_score, confusion_matrix, f1_score, roc_auc_score
from sklearn.metrics import roc_curve
def get_clf_eval(y_test, pred=None, pred_proba=None):
    confusion = confusion_matrix(y_test, pred)
    accuracy= accuracy_socre(y_test, pred)
    precision = precision_score(y_test, pred)
    recall = recall_score(y_test, pred)
    f1 = f1_score(y_test, pred)
    roc_auc = roc_auc_score(y_test, pred_proba)
    print('error matrix')
    print(confusion)
    print('Accu : {0:.4f}, Prec : {1:.4f}, Recu : {2:.4f},\
             F1 : {3:.4f},  AUC : {4:.4f}'.format(accuracy, precision, recall, f1, roc_auc))
728x90
반응형